


GBPUSD flatlines near channel’s upper band

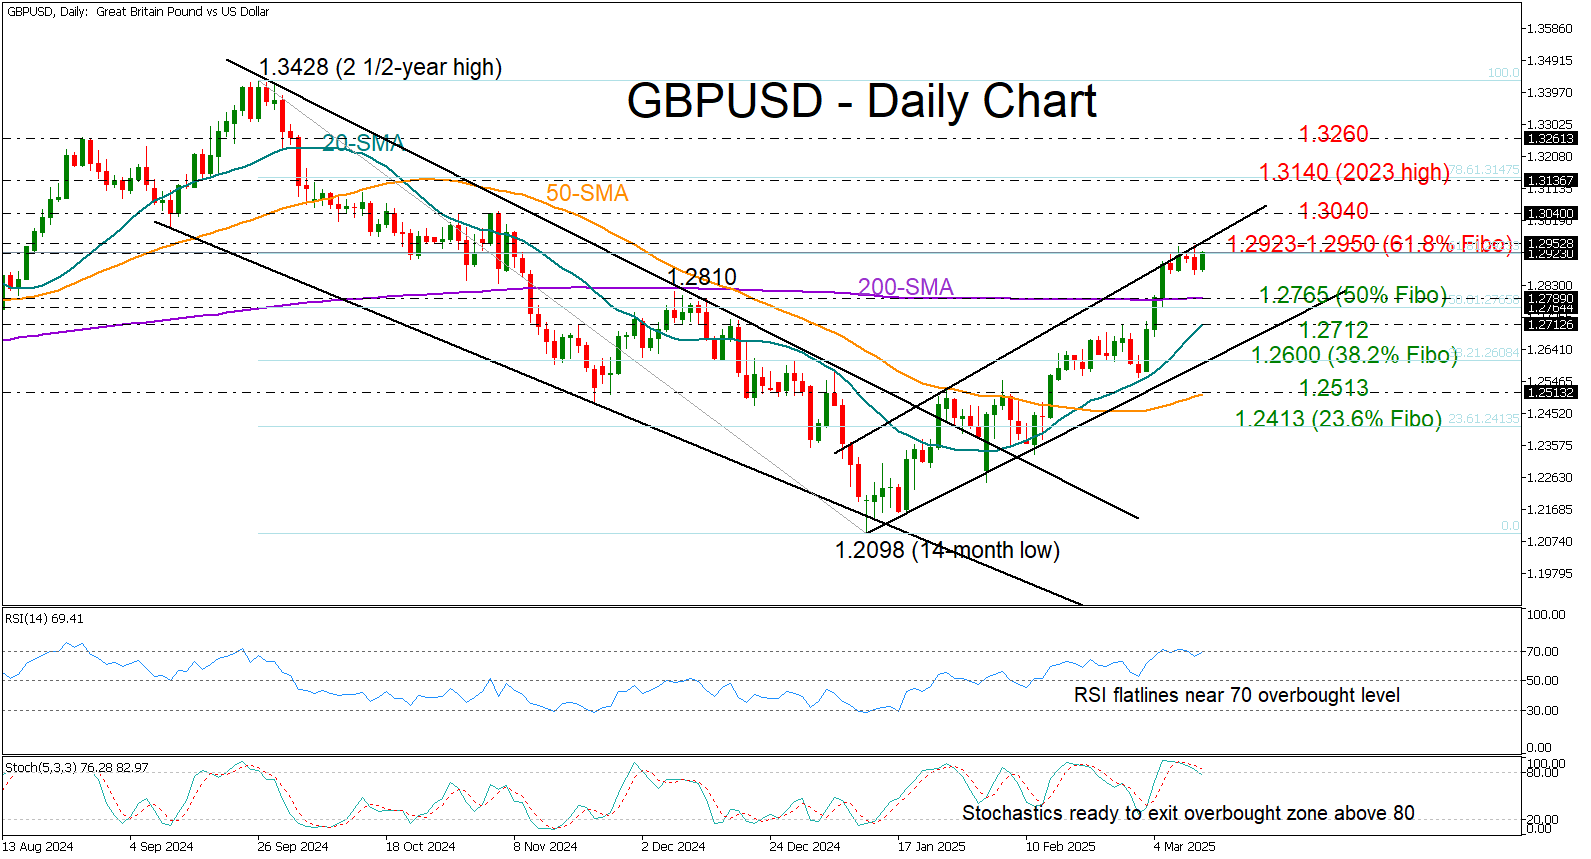
GBP/USD has been treading water around the 1.2923 level, struggling to gain further traction after its March bull run stalled near the upper boundary of its bullish channel.
The pair surged as high as 1.2945 last week, marking its highest level since November 2024. However, strengthening overbought signals suggest the recent rally may be losing steam, as the RSI and the stochastic oscillator seem to have peaked above 30 and 20, respectively.
A decisive breakout above the 1.2923-1.2950 resistance—aligned with the 61.8% Fibonacci retracement of the prior downtrend—could reignite buying interest. If the November peak of 1.3040 is surpassed, momentum could build toward the 2023 high of 1.3140, with the next resistance possibly emerging near 1.3260, a key barrier from August 2024 and March 2022.
On the flip side, if sellers regain control, the pair may retreat toward the 200-day simple moving average (SMA), which hovers just above the 50% Fibonacci level of 1.2765, and the 20-day SMA at 1.2712. Further losses could bring the lower band of the bullish channel into play around the 38.2% Fibonacci level of 1.2600, ahead of the 50-day SMA at 1.2513.
In summary, GBP/USD is at a crucial juncture. A push beyond 1.2950 and out of the bullish channel could inject fresh momentum. Otherwise, the next move could see the pair sliding backwards.
Add a Comment

Pound Among the Winners Boosted by US Dollar Weakness and Rate Cut Prospects

ATFX Market Outlook 17th April 2025

ATFX Market Outlook 16th April 2025

Continued Trade Tensions Steer Markets: April 15, 2025

ATFX Market Outlook 15th April 2025

Weekly Technical Outlook – EUR/USD, GBP/USD, USD/CAD

Trade War Tensions Escalate Moneta Markets Daily Market Update: April 14, 2025


