Wall Street Continue to Slides On Hawkish Fed Expectation
- Wall Street ends the last session of 2024 lower, weighing on Hawkish Fed speculation.
- The dollar regained strength in the last session.
- Oil remained on an uptrend in the last session despite the fact that it concluded the year with a drop of 3%.
Market Summary
Wall Street continued its downward trend, pressured by expectations of a more hawkish Fed policy in the near term. However, traders are anticipating a potential “Trump Trade” rally, as Donald Trump’s upcoming inauguration in January may boost sentiment in the equity markets. Meanwhile, the U.S. dollar found support and rebounded in the final session of 2024, bolstered by climbing U.S. long-term Treasury yields and nearing its next resistance level. Traders are also advised to monitor the UK PMI reading for insights into the Pound Sterling, which has struggled in recent sessions. In the commodity market, both gold and oil saw slight gains, but both remain vulnerable to the strengthening dollar and a pessimistic economic outlook for 2025, suggesting potential downside pressure ahead.
Current rate hike bets on 29th January Fed interest rate decision:
Source: CME Fedwatch Tool
0 bps (90.4%) VS -25 bps (9.6%)
Market Movements
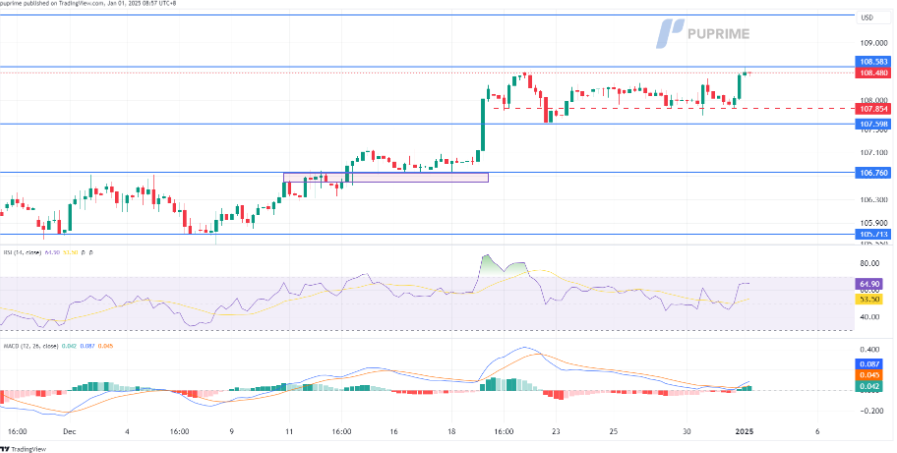
DOLLAR_INDX, H4
The dollar rebounded from its short-term support at 107.85, climbing 0.4% in the last session and maintaining its bullish trajectory. Gains in U.S. Treasury yields and persistent hawkish Fed expectations supported the greenback. A breakout above the next resistance at 108.60 could signal further upside momentum for the dollar.
The Dollar Index successfully found its support at the 107.85 mark and performed a technical rebound, suggesting a bullish bias for the index. The RSI has recovered from above the 50 levels, while the MACD shows signs of rebounding from above the zero line, suggesting bullish momentum is forming.
Resistance level: 108.60, 109.50
Support level: 107.60, 106.75
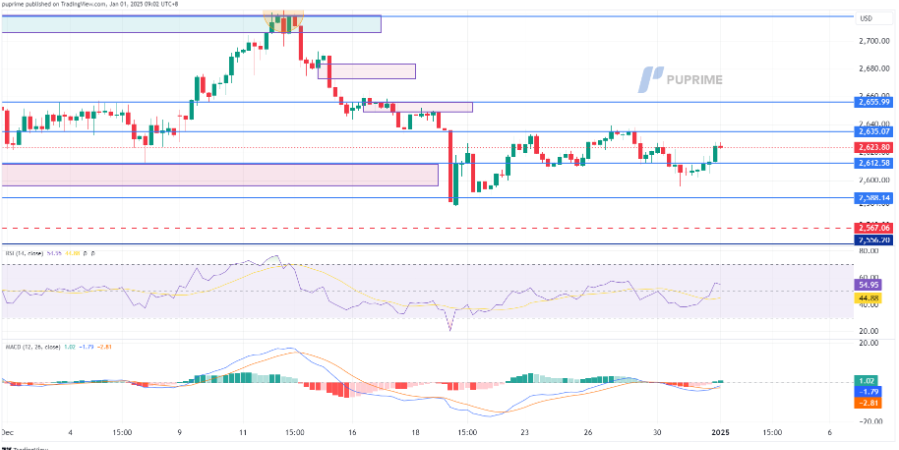
XAU/USD, H4
Gold prices edged higher in the last session but failed to reclaim previous highs, indicating that the metal remains within its bearish trajectory. With no clear catalyst, gold's movement continues to be dictated by dollar strength, which has recently exerted downward pressure on the precious metal.
Gold prices have been sideways in a wider range lately but are forming a bearish trend. If gold prices were kept below their previous high at $2625, it may be seen as a bearish signal for gold. The RSI has rebounded slightly while the MACD is hovering closely toward the zero line, which gives a neutral signal for gold.
Resistance level: 2635.00, 2656.00
Support level: 2612.00, 2588.00
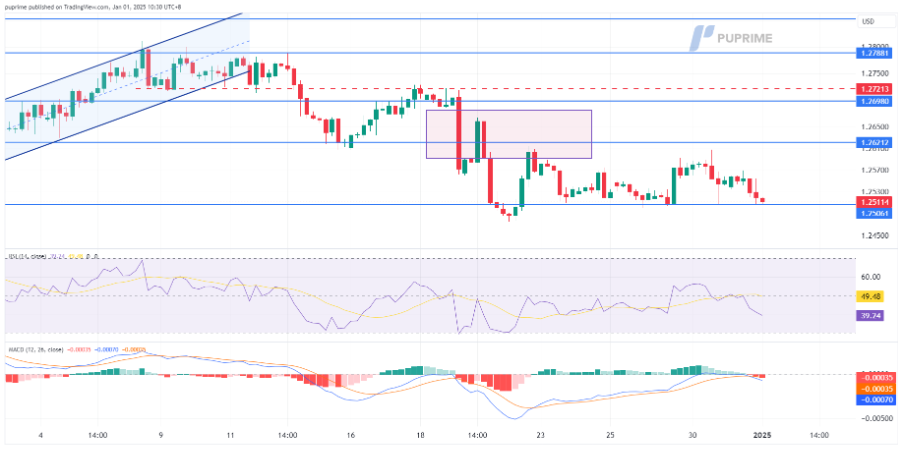
GBP/USD,H4
The GBP/USD pair has slid and is now testing its support level at 1.2505. A break below this level would signal a bearish outlook for the pair. The Pound Sterling has been lacklustre in recent sessions, with the Pound Sterling Index (BXY) falling to its lowest level since May. Traders should keep an eye on Thursday's UK Manufacturing PMI reading, as it will provide insight into the strength of the Sterling.
The pair is traded sideways in a wide range. A break below its next support level shall be seen as a bearish signal for the pair. The RSI has been kept below the 50 level while the MACD failed to break above the zero line, suggesting that the pair remains trading with bearish momentum.
Resistance level: 1.2620, 1.2700
Support level: 1.2505, 1.2408
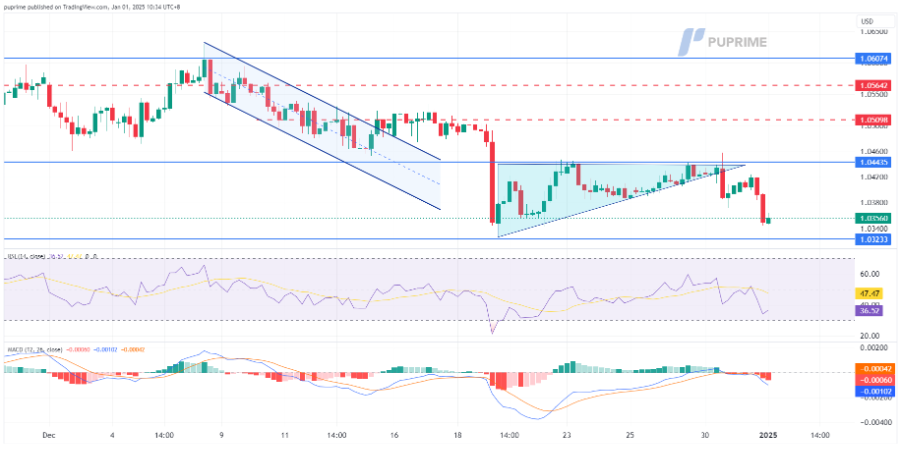
EUR/USD,H4
The EUR/USD pair has breached its ascending triangle pattern, indicating a bearish bias. The pair extended its downward movement, sliding by an additional 0.5% in the last session. With the euro lacking a clear catalyst, the pair is primarily influenced by the strength of the dollar. The dollar's recent gains, driven by hawkish Fed expectations, have exerted further downside pressure on the EUR/USD.
The pair has slid to its previous low level at near 1.0349. A break below this level would be a bearish signal for the pair. The RSI dropped to near the oversold zone while the MACD failed to break above the zero line, suggesting that the pair remains trading with bearish momentum.
Resistance level: 1.0440, 1.0515
Support level: 1.0323, 1.0238
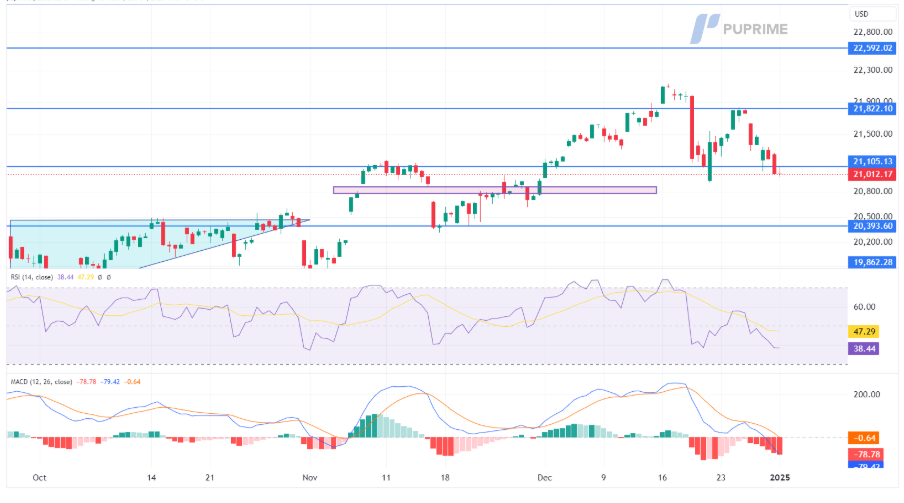 NASDAQ,H4
U.S. equity markets continued to face pressure, with the Nasdaq falling nearly 1% in the shortened session yesterday. The broader equity market remains under significant downside pressure, influenced by expectations of a more hawkish Fed stance. The Nasdaq has now reached a critical support level at the 21,000 mark; a break below this level would signal a stronger bearish outlook for the tech-heavy index.
The Nasdaq is now approaching its previous low level; a break below this level would be a bearish signal for the index. The RSI is getting closer to the oversold zone, while the MACD has broken below the zero line, suggesting that the bearish momentum is gaining.
Resistance level: 21,820.00, 22,590.00
Support level: 20,395.00, 19,860.00
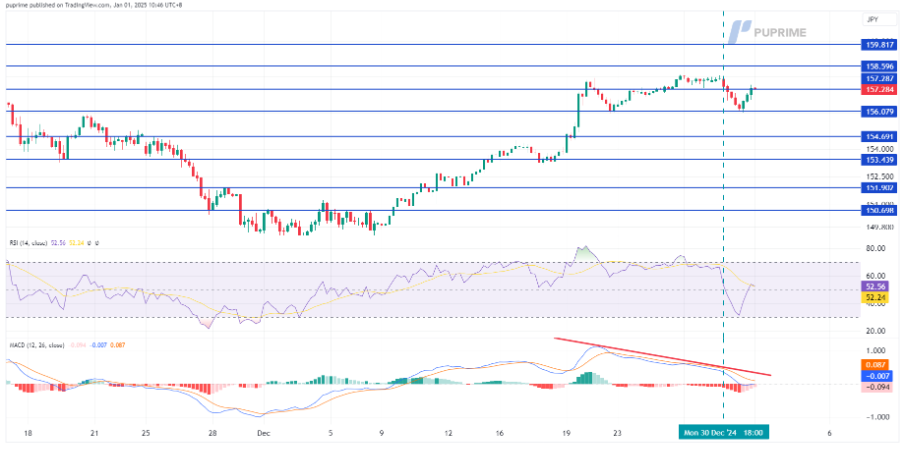
USD/JPY, H4
The USD/JPY pair rebounded yesterday as the dollar regained strength in the final trading session of 2024. However, a bearish divergence signal has emerged, indicating a potential trend reversal in the near term. The Japanese Yen has regained some strength, bolstered by renewed speculation of a rate hike by the BoJ in January, which has helped to support the Yen after its recent underperformance.
USD/JPY rebounded but has yet to reach its previous high level, suggesting that the pair remains trading within its bearish trajectory. The RSI rebounded while the MACD remained close to the zero line, suggesting that the pair remained trading with bearish momentum.
Resistance level: 158.60, 159.80
Support level: 156.00, 154.70
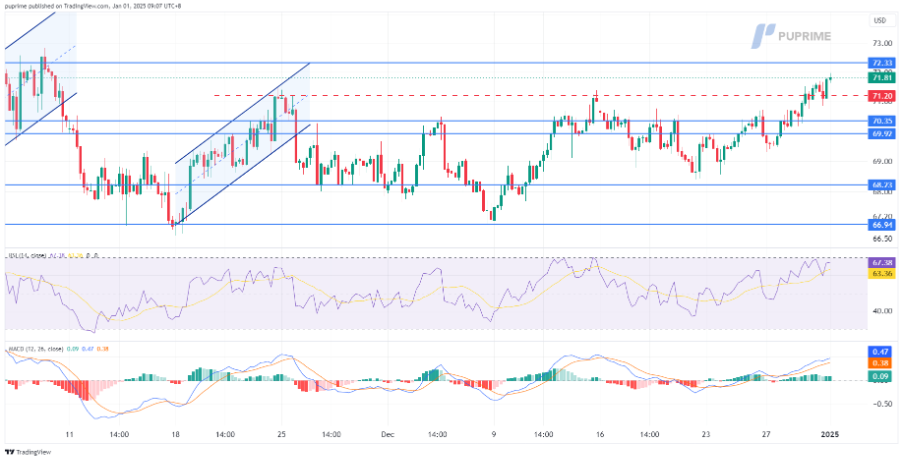
CL OIL, H4
Oil prices have recently surged past the previous high of $71.20, signaling a bullish trend for the commodity. The upward movement is supported by forecasts of colder weather, which could drive increased demand for heating fuels.
Oil prices have been rising and have broken above their short-term resistance level, suggesting a bullish signal for oil. The RSI is close to the overbought zone, while the MACD is edging higher, suggesting that the bullish momentum is gaining.
Resistance level: 72.35, 74.65
Support level: 70.35, 68.25


