


GOLD Analysis: Beware of intraday bull traps

Fundamental Analysis of GOLD
GOLD Key Takeaways
Risk aversion drives gold prices: US President Trump previously threatened tariffs on Mexico and Canada, and then decided to delay, which increased uncertainty and drove safe-haven demand.
Tariffs drive gold prices: If tariffs are further expanded, it only means that the price of gold in the United States will be more expensive than before.
Technical Analysis of GOLD Daily and Hourly Charts
GOLD Daily Chart Insights
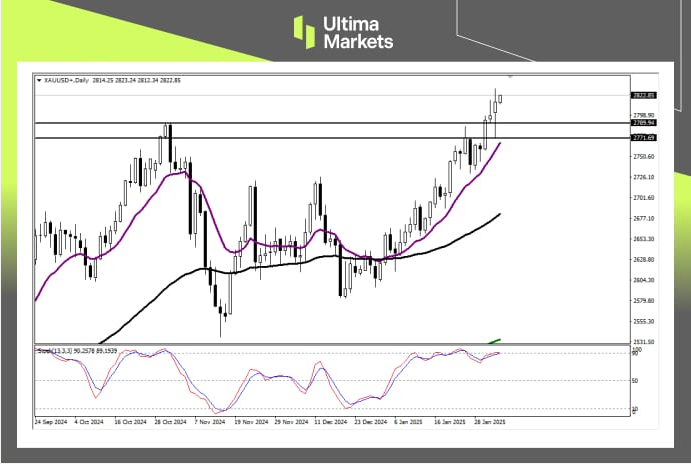 (GOLD Daily Price Chart, Source: Ultima Markets MT4)
Stochastic oscillator: The indicator sent a bullish signal again after leaving the overbought area, suggesting that short-term bullish forces have the upper hand again. But it is worth noting that the current indicator slope is slower than before, and the long and short are still in the game stage. Be alert to the appearance of a top divergence pattern.
Price Action: Yesterday, gold fell back to the opening price of the order block near 2771.69, but eventually closed higher. The huge fluctuations suggest that the long and short forces are in a game, and the short-term bulls are more dominant. It is worth paying attention to the long opportunities during the Asian session.
GOLD 1-hour Chart Analysis
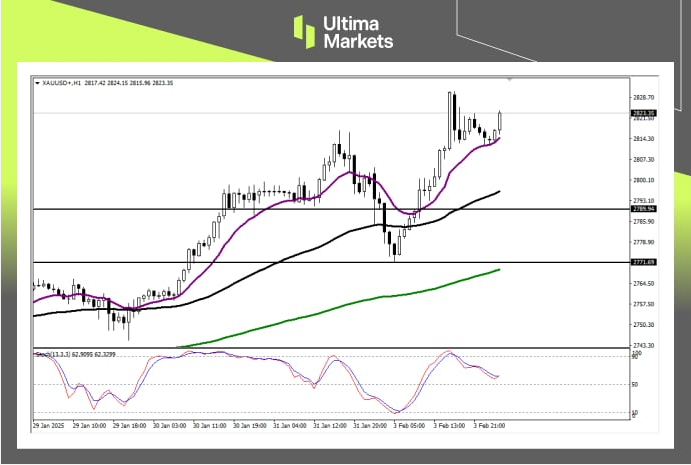 (GOLD H1 Price Chart, Source: Ultima Markets MT4)
Stochastic oscillator: The indicator slowed down its upward momentum during the US session yesterday and fell after sending a short signal. There are signs of upward movement again during the Asian session, but based on the slightly shorter adjustment time period, it is preferred to judge that the current rise is a rebound.
Trend direction: Based on the judgment of the rebound during the Asian session, 2823 is the key resistance price during the day, and there is a probability that the gold price will be blocked and adjusted. If it starts to fall, the first target below is the purple 13-period moving average, and it is worth paying attention to the opportunity to enter the market and go long.
Pivot Indicator Insights for GOLD
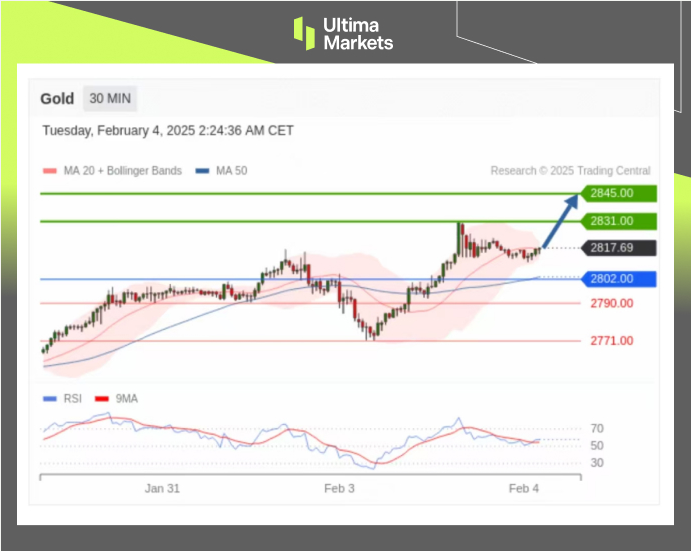 (GOLD M30 Price Chart, Source: Ultima Markets APP)
According to Pivot Indicator in Ultima Markets APP, the central price of the day is established at 2802,Bullish Scenario: Bullish sentiment prevails above 2802, first target 2831, second target 2845;Bearish Outlook: In a bearish scenario below 2802, first target 2790, second target 2771.
How to Navigate the Forex Market with Ultima Markets To navigate the complex world of trading successfully, it’s imperative to stay informed and make data-driven decisions. Ultima Markets remains dedicated to providing you with valuable insights to empower your financial journey.
For personalized guidance tailored to your specific financial situation, please do not hesitate to contact Ultima Markets.
Join Ultima Markets today and access a comprehensive trading ecosystem equipped with the tools and knowledge needed to thrive in the financial markets.
Stay tuned for more updates and analyses from our team of experts at Ultima Markets.
—–
Legal Documents
Ultima Markets, a trading name of Ultima Markets Ltd, is authorized and regulated by the Financial Services Commission “FSC” of Mauritius as an Investment Dealer (Full-Service Dealer, excluding Underwriting) (license No. GB 23201593). The registered office address: 2nd Floor, The Catalyst, 40 Silicon Avenue, Ebene Cybercity, 72201, Mauritius.
Copyright © 2025 Ultima Markets Ltd. All rights reserved.
Disclaimer
Comments, news, research, analysis, price, and all information contained in the article only serve as general information for readers and do not suggest any advice. Ultima Markets has taken reasonable measures to provide up-to-date information, but cannot guarantee accuracy, and may modify without notice. Ultima Markets will not be responsible for any loss incurred due to the application of the information provided.

ADP jobs report: broad-based and strong growth

Cryptocurrency market takes a wait-and-see approach

EBC Markets Briefing | China and Europe still investable under US tariffs

Market sentiment remains fragile as Trump takes aim at Iran

EBC Markets Briefing | Yen regains safe-haven appeal

ATFX Economic Calendar- 2025.02.03~2025.02.07

ATFX Market Outlook 4th February 2025


