-782024624.png)
-782024624.png)


Gold: a reversal or a typical retreat?

Gold made an impressive 3% surge during the week, breaking May's all-time highs. However, it then retreated to the downside, selling off throughout the second half of the week. What should you watch out for to see if this is a reversal?
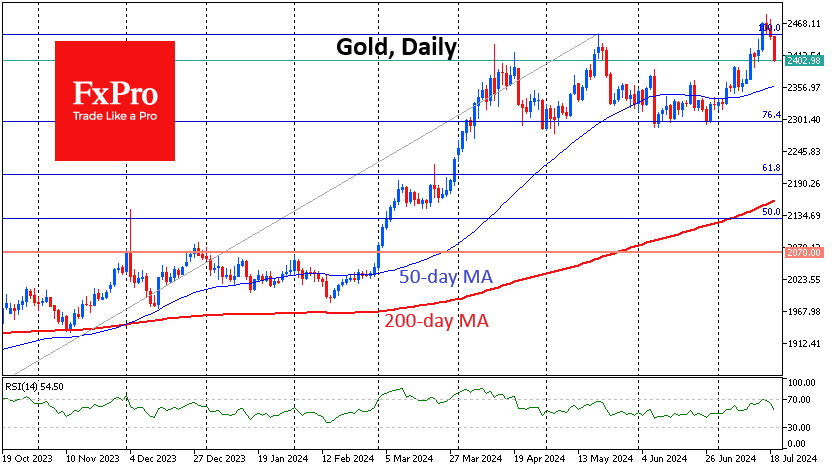
Pullbacks after making new highs have been a typical pattern for gold in recent months, with similar retreats in May, April, March, and December. The highs were followed by a pullback, which subsided within about two weeks, leading to a stabilisation of the price and a return to the upside.
However, bull markets do not last forever, and traders should look for signs that this bullish trend is reversing. We pay attention to the following warning signals.
A synchronised pull-out of risk assets: Along with gold, stock indices were also under pressure this week. After a long divergence, all four key indices (Nasdaq-100, S&P 500, Dow Jones 30, Russell 2000) were down on Thursday. The last all-time high for gold and the S&P500 came on 17 June, also indicating a synchronised reversal.
A falling relative strength: The upward impulses taking the gold price to new highs coincide with increasingly lower RSI peaks. In March, at the $2179 price closing high, the RSI peaked at 84. In April, with the price closing high at $2392, the RSI was climbing to 73. In the outgoing week, the record close was at $2468, with RSI at 70. We deliberately skipped the May peak with a closing high of $2425 and RSI at 67, as that upside momentum was relatively small - about 6%.
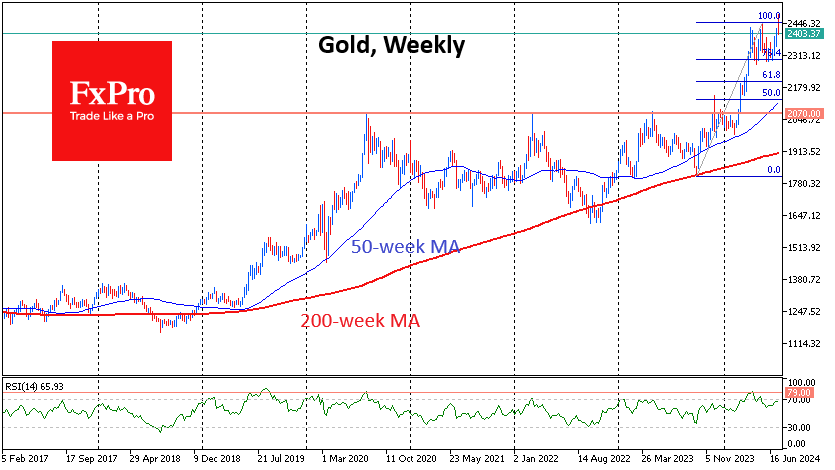
Next week could determine the momentum for months to come. Drops of more than 3% next week could repeat the pattern of 2020 and 2022 with protracted corrections of more than six months. Most worrisome would be a repeat of the 2011 pattern, when the high of $1921 was followed by a 20% sell-off over four weeks. This peak was not rewritten until nine years later, and from the global peak to the global bottom, the value of a troy ounce almost halved, declining for more than four years.
By the FxPro Analyst Team


NZDUSD, USDJPY, EURUSD

Gold stalls near 2,700. Is it losing its shine?

EUR/USD Amid Slowing European Economy

Geopolitics and Trump’s cabinet selections guide market sentiment

Crypto Recharged Over the Weekend

Macro data showed divergence, with a significant rise last Friday; geopolitical tensions have escalated, and gold prices have risen back above 2710

EBC Markets Briefing | Aussie dollar firmed despite China concerns


