Advertisement
波動率過濾
外匯波動率
| 貨幣 | 1分鐘 | 5分鐘 | 15分鐘 | 30分鐘 | 1小時 | 4小時 | 每日 | 每週 | 月度 |
|---|---|---|---|---|---|---|---|---|---|
| AUDCAD | 1.9 | 5.0 | 13.1 | 15.9 | 19.8 | 70.8 | 117.7 | 590.2 | 188.3 |
| AUDJPY | 3.7 | 10.9 | 16.3 | 16.3 | 21.8 | 110.2 | 219.5 | 918.0 | 393.2 |
| AUDNZD | 1.8 | 4.3 | 5.4 | 6.1 | 8.4 | 42.7 | 84.7 | 326.6 | 206.6 |
| AUDUSD | 1.6 | 5.5 | 7.8 | 11.6 | 20.0 | 65.5 | 134.1 | 455.1 | 204.2 |
| CADJPY | 4.6 | 13.2 | 23.5 | 24.6 | 25.5 | 82.2 | 176.6 | 383.3 | 448.9 |
| EURAUD | 5.9 | 23.9 | 25.5 | 38.2 | 40.8 | 201.4 | 448.5 | 1305.5 | 701.7 |
| EURCAD | 6.9 | 22.1 | 28.4 | 34.7 | 34.7 | 135.9 | 301.4 | 362.9 | 854.0 |
| EURCHF | 1.1 | 4.9 | 10.8 | 16.4 | 16.4 | 42.5 | 193.9 | 336.0 | 316.3 |
| EURCZK | 73.2 | 110.9 | 142.4 | 142.4 | 316.5 | 1052.4 | 1111.2 | 3830.8 | 3017.8 |
| EURGBP | 1.8 | 7.7 | 8.5 | 14.0 | 16.6 | 45.0 | 147.8 | 209.6 | 201.5 |
| EURJPY | 2.8 | 7.6 | 19.8 | 29.0 | 29.0 | 139.6 | 169.8 | 596.8 | 859.2 |
| EURUSD | 4.9 | 10.8 | 12.2 | 24.0 | 36.6 | 99.4 | 311.8 | 368.6 | 566.2 |
| GBPJPY | 4.0 | 15.1 | 27.8 | 37.6 | 47.1 | 104.3 | 306.0 | 965.5 | 772.0 |
| GBPUSD | 3.9 | 6.7 | 9.7 | 15.9 | 22.4 | 94.2 | 175.9 | 382.6 | 440.4 |
| NZDUSD | 1.5 | 3.8 | 6.6 | 10.8 | 18.1 | 62.8 | 137.7 | 315.3 | 237.9 |
| USDCAD | 1.2 | 8.6 | 17.8 | 17.8 | 31.4 | 87.0 | 158.5 | 387.7 | 307.6 |
| USDCHF | 4.1 | 5.0 | 9.5 | 15.4 | 27.2 | 73.2 | 370.1 | 378.6 | 275.5 |
| USDJPY | 6.3 | 14.6 | 22.2 | 27.6 | 44.1 | 149.8 | 375.1 | 593.7 | 476.3 |
| XAGUSD | 1.5 | 4.1 | 7.1 | 8.7 | 15.1 | 90.1 | 73.9 | 613.0 | 346.0 |
| XAUUSD | 96.0 | 229.0 | 301.0 | 457.0 | 706.0 | 3295.0 | 11281.0 | 19064.0 | 26891.0 |
What is volatility in Forex trading
Volatility is a term used to statistically describe the variation in trading prices. The higher the number, the higher the market volatility is. Alternatively, the lower the number, the lower volatility is.
For example, if EURUSD moves from 1.1200 to 1.1250, this means a volatility of 50 pips or 0.44%. Alternatively, if GBPUSD moves from 1.3800 to 1.3900, this represents a volatility of 100 pips or 0.72%. Looking at both pairs, you can now compare volatility and say which currency is more volatile during the inspected time frame. Important to note that pips are not always a suitable measure for volatility when comparing pairs with high variation in pip value.
How is volatility measured?
Volatility is the difference between the high and low values of a price in a symbol. Some traders use indicators to measure volatility such as average true range (ATR), bollinger bands, moving averages or standard deviation, however at the table above you can quickly compare multiple symbols across different timeframes and thus save you time.
Why is volatility important?
Volatility tells you how drastically a certain currency has moved within a timeframe. This helps you adjust your trading systems and trading times to perfectly suit your trading style. Usually, a Forex trader looking for low and steady returns and less risk would prefer to trade low volatility pairs. On the other hand, traders that can accept higher risk would prefer to trade high volatility pairs to profit from the volatile price movements. Keep in mind that other factors such as your 倉位大小 should be part of your risk management.
What causes volatility of currency pairs?
Volatility represents the price movements of a currency due to the buy and sell orders. The more buying or selling pressure there is, it will quickly move to the appropriate direction.
This is of course mostly visible during important economic events of the related economies.
What is the most volatile Forex pair
Usually the exostic pairs and crosses are the most volatile in Forex. This is due to the weak economies which are unstable and cause the volatile fluctuation of the local currency. The major pairs which are the most traded and are of the strongest economies have a lower volatility as they have stable and strong economies.
How to use our Forex volatility?
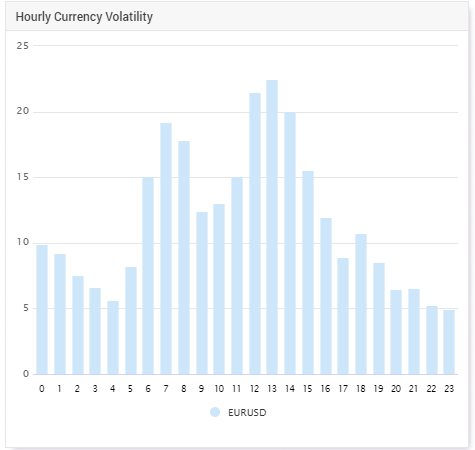
Use the table to analyze, sort and compare the different volatility pairs. You can define min and max levels to easily filter out the irrelevant date for your trading strategy. Entering the volatility section of a specific currency will reveal an abundance of information such as hourly volatility, daily weekly and monthly volatility as well as the ability to compare all of these metrics against other symbols.


