Advertisement
पिवट पॉइंट कैलक्यूलेटर
What is the pivot point in forex trading?
Pivot Points are a technical analysis indicator used to determine reversal points on all time frames.
there are multiple variations of Pivot Points such as:
- Floor (standard)
- Woodie's
- Camarilla
- DeMark's
What is (the) pivot point in forex?
Pivot Points in forex are predetermined levels where the market sentiment could potentially change from bullish to bearish or vice versa.
How to trade pivot points in forex?
There are many ways to trade pivot points in forex, but simplicity is key. So, the easiest and most common ways to use Pivot Points in forex trading is by utilizing them as levels of support & resistance.
So, for example if price is bullish, and approaching a pivot point, then we will treat that level as resistance and act accordingly. If we get a bounce we sell, if we get a breakout we buy. Bear in mind that trading is not that simple, but that is the main idea behind it, and also it is by far the most common way traders use pivot points.
One other way traders use pivot points is to determine Stop Loss and Profit Taking levels. Usually the SL & TP are placed right above or below a pivot point for extra protection in case of a SL, and just before hitting the Pivot Point in case of Profit Taking.
How to use a pivot point calculator?
Since pivot points are basically a combination of calculations for the: open, close, high & low, using them in the calculator is fairly simple and straightforward.
- Choose the currency pair you wish to trade (EUR/USD in this example)
- Choose the time frame (in this example we will use the 4H Time Frame)
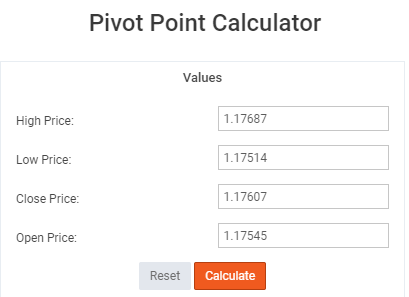
- Enter the: High, Low, Close, Open for the last closed candle in the Pivot Point Calculator (see example 1)
Example 1:

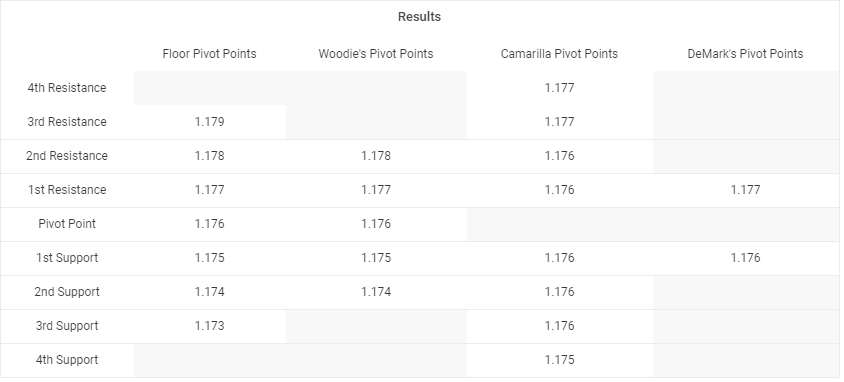
After you click “calculate” the chart below you will automatically calculate the levels you need to plot on your EUR/USD - H4 chart, with variance of which Pivot Point you want to use.
Example 2:

How to calculate pivot points in day trading?
Calculating Pivot Points in day trading is the same as the example shown above, just with different values. In the above example we used an H4 time frame, but for day trading we can use the H1, M30, and M15 (even though this time frame is a split between day trading and scalping)
So, let’s say we use H1 (the most common intraday trading time frame used by forex traders), the procedure is the same. We take the last closed candle, enter the values of the open, close, high & low in the calculator, click “calculate” and then plot the given levels on our H1 chart.
How to calculate weekly pivot points?
Calculating weekly pivot points is the same as mentioned above, just a different time frame. We take the high, low, open, close of last week’s candle, we input into the pivot point calculator, and after that the process is the same.


