-11122024742.png)
-11122024742.png)


The dollar index breaks multi-year support

The dollar index breaks multi-year support
The dollar index returned to the lows of September last year after a brief surge at the start of the week. The rebound of the US currency was only sufficient to close the gap created by the announcement of tariffs.
The technical picture since the beginning of the month indicates that the dollar index is entering a new phase of active decline after the rebound at the end of March. Potential downside targets are in the range of 99-100. The lower boundary of this zone aligns with the 161.8% level of the initial decline, while the upper boundary represents the psychologically significant round level that previously halted the USD decline in September last year.
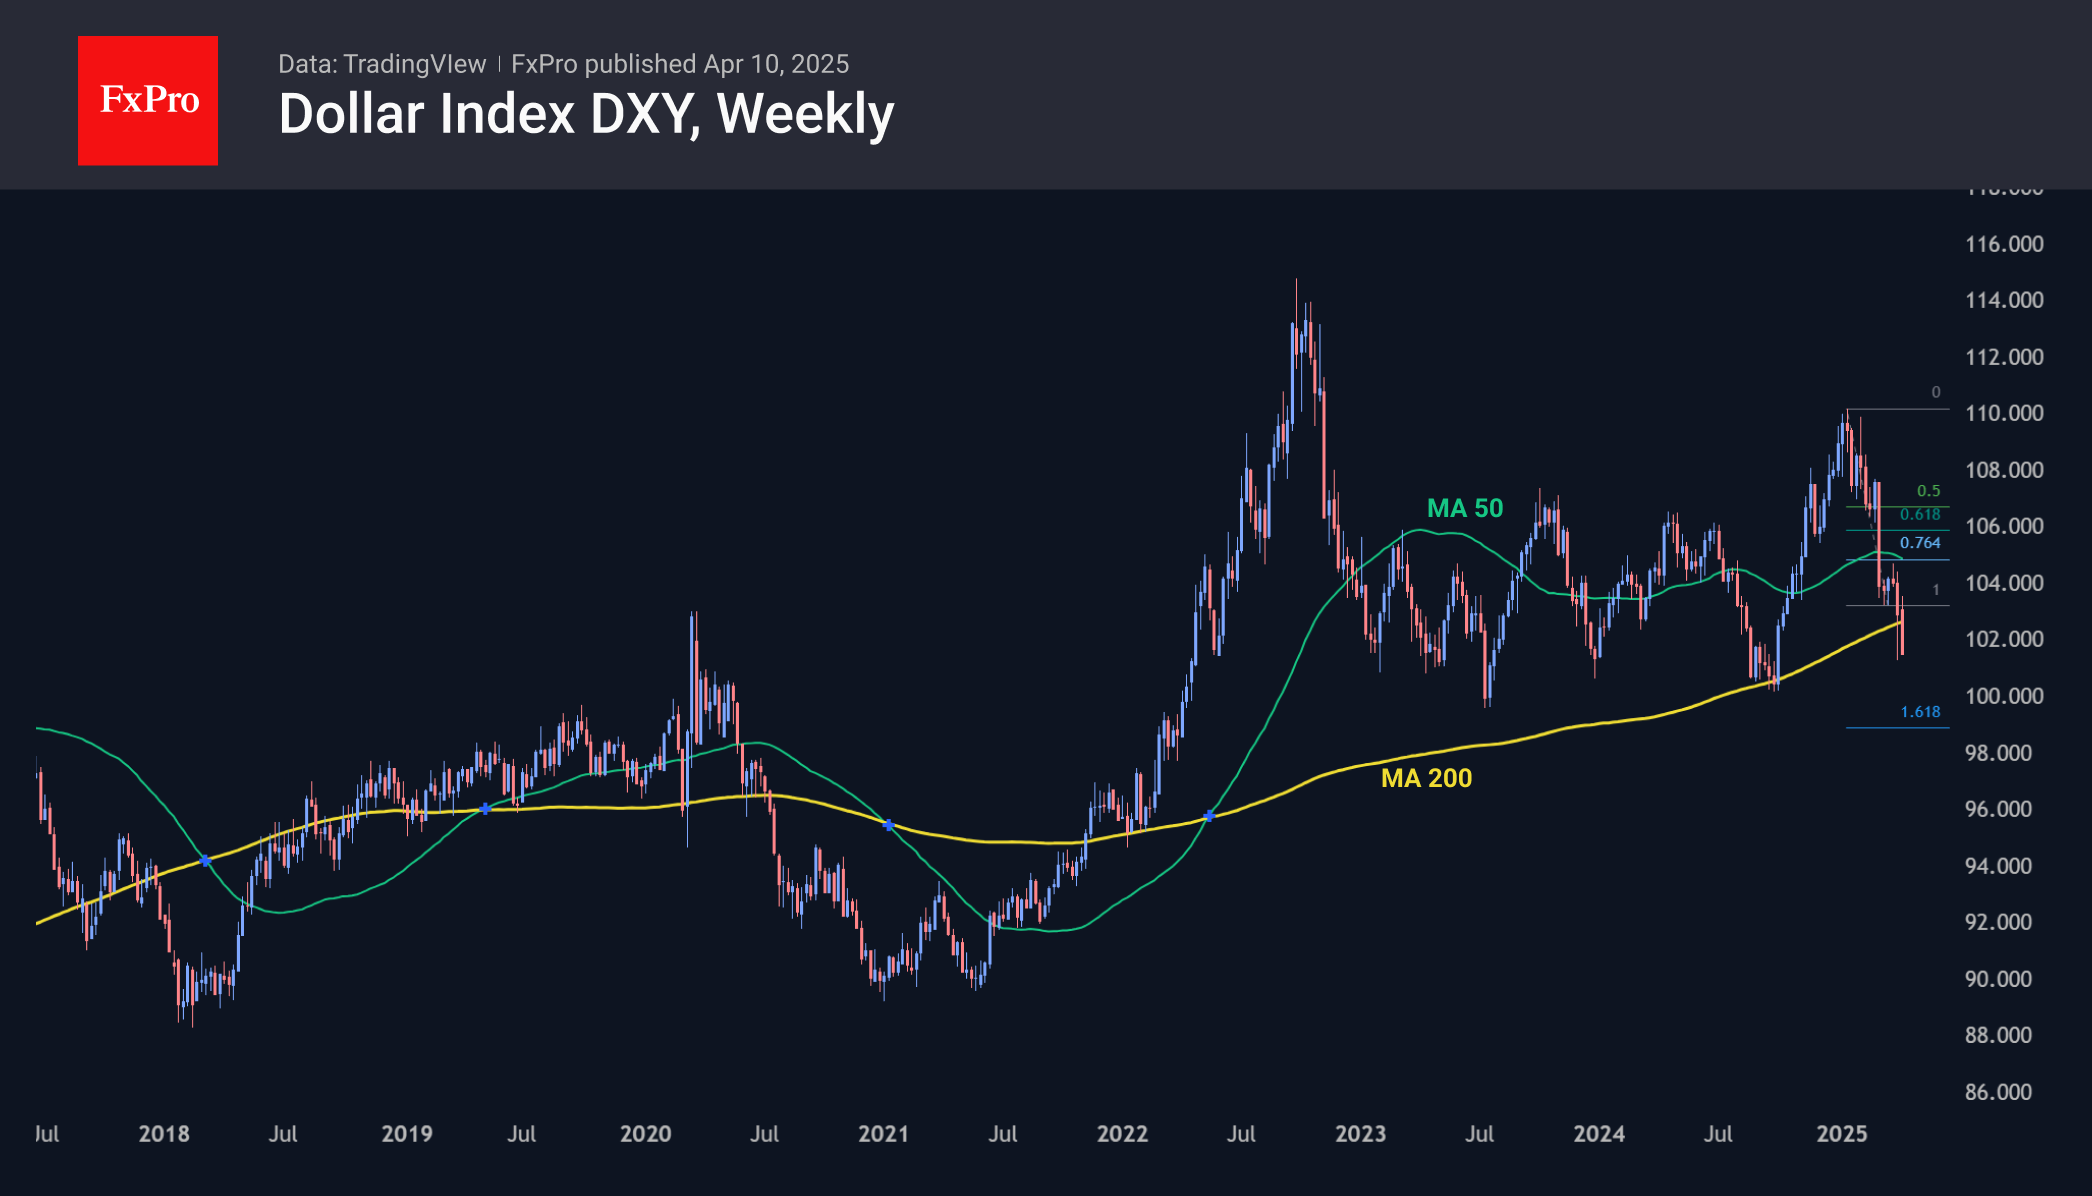
On the weekly charts, the bearish sentiment appears even stronger. The USD index has fallen below the 200-week moving average, which has acted as robust support over the past three years. This could signal a reversal of a multi-year trend. Similar signals five years ago led to the dollar losing 7% before reaching its lowest point, while in 2017, the decline was 5%.
By the FxPro Analyst Team


Tariff news and resistance zone put pressure on crypto

Tariff news and resistance zone put pressure on crypto

Japanese Yen Surges as Weak US Dollar Fuels Momentum

Risk sentiment retreats as Trump prepares for fresh tariff decisions

US-China Trade War Escalates: What Traders Need to Know

Ever Wondered Why the FCA Is the Gold Standard in Financial Regulation?

ATFX Market Outlook 16th April 2025


