Wall Street Dip on AI Jitters
- Wall Street Plummet with Nasdaq plunged by more than 700 points on AI jitters.
- Japanese Yen strengthened ahead of BoJ’s interest rate decision on heightened Hawkish monetary policy expectations.
- BTC and ETH dipped as the market's risk appetite deteriorated.
Market Summary
The U.S. equity market experienced one of its worst trading days this year, with the Nasdaq leading the decline, plunging more than 700 points in the last session. Investor concerns over the AI sector surged following Tesla's earnings miss and Google's higher-than-expected spending, both of which saw sharp declines. Meanwhile, the dollar remained stable as the U.S. PMI reading showed mixed results. However, the Australian and New Zealand dollars continued to weaken against the U.S. dollar due to expectations of dovish pivots by their respective central banks.
In contrast, the Japanese Yen continued to strengthen ahead of next week's BoJ interest rate decision, with increasing expectations that the BoJ may opt for a more restrictive monetary policy. Traders should closely monitor today's U.S. GDP reading to gauge the direction of the dollar.
In the commodity market, gold erased all its gains from the previous session, while oil prices continued to slide amid pessimistic economic performance and a deteriorating demand outlook. The decline in risk appetite also impacted cryptocurrencies, with both BTC and ETH erasing their weekly gains.
Current rate hike bets on 31st July Fed interest rate decision:
Source: CME Fedwatch Tool
0 bps (93.3%) VS -25 bps (6.7%)
Market Movements
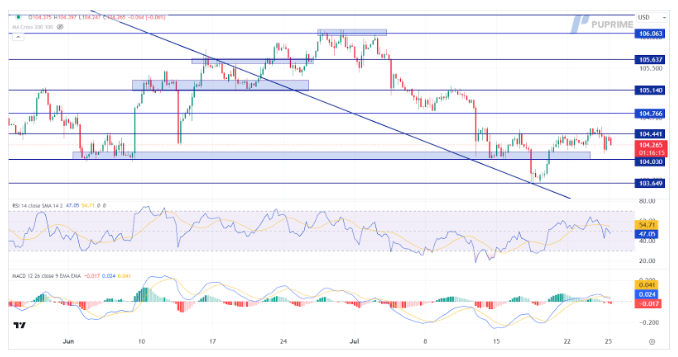
DOLLAR_INDX, H4
The Dollar Index, which measures the dollar against a basket of six major currencies, continues to consolidate as investors await several crucial US economic data releases. The US economic outlook remains uncertain due to mixed recent data. Despite this, investors should focus on upcoming economic indicators for further trading signals and monitor for any potential breakouts. With the Federal Reserve's interest rate decisions on the horizon, economic data will be crucial in shaping market expectations.
The dollar index is trading lower following the prior retracement from the resistance level. MACD has illustrated increasing bearish momentum, while RSI is at 47, suggesting the index might extend its losses since the RSI stays below the midline.
Resistance level: 104.45, 104.75
Support level: 104.05, 103.65
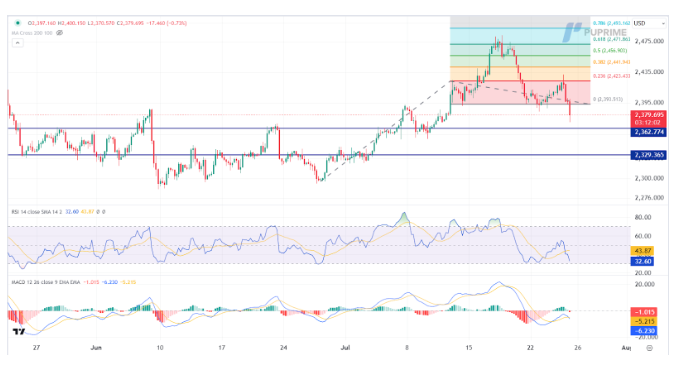
XAU/USD, H4
Gold prices tumbled after breaking the psychological level of 2400, likely due to a technical breakout. US economic data released yesterday showed mixed results, with S&P Global US Manufacturing PMI and New Home Sales coming in worse than expected at 49.5 and 617K, respectively, compared to forecasts of 51.7 and 639K. On the other hand, S&P Global Services PMI was better than expected at 56, compared to 54.7. Given the mixed data, investors are advised to monitor further US economic indicators, including GDP, Initial Jobless Claims later today, and Friday's Core PCE Price Index, for more insights into gold's future trends.
Gold prices are trading lower following the prior breakout below the previous support level. MACD has illustrated increasing bearish momentum, while RSI is at 32, suggesting the commodity might extend its losses since the RSI stays below the midline.
Resistance level: 2395.00, 2425.00
Support level: 2365.00, 2330.00
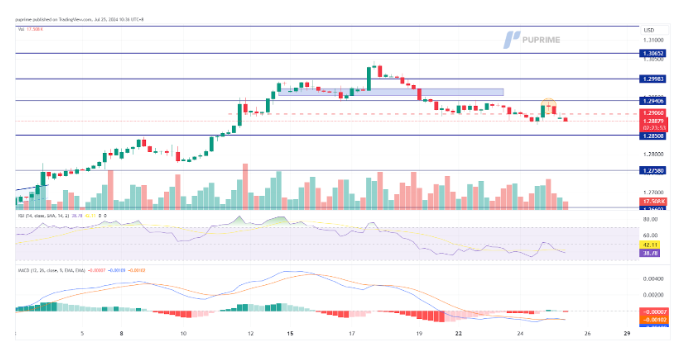
GBP/USD,H4
The GBP/USD pair dropped below its crucial liquidity zone in the earlier session due to a mixed result of the UK PMI readings. However, the U.S. mixed PMI readings revealed in the later session bolstered the pair from dipping further. Despite this support, an evening star pattern has been spotted, which may indicate a potential trend reversal for the pair. Traders should watch for further confirmation of this bearish signal.
Despite a technical rebound, the pair has formed an evening star price pattern, suggesting a trend reversal signal. The RSI remains in the lower region, while the MACD flows below the zero line, suggesting that the pair's bearish momentum remains strong.
Resistance level: 1.2990, 1.3065
Support level: 1.2850, 1.2760
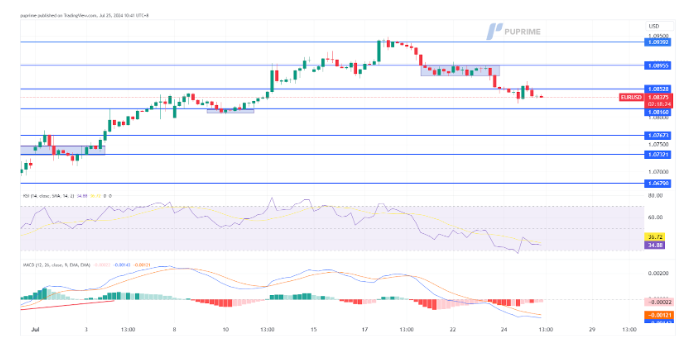
EUR/USD,H4
The euro was dragged down by yesterday's lower-than-expected PMI reading, trading to its lowest level in two weeks. However, the pair took a breather from dipping further as the U.S. dollar's strength was hindered by mixed PMI readings, leaving the pair hovering at its recent low level. The U.S. GDP data, due later today, will be a pivotal factor for the pair's price movement. Traders should watch this release closely for potential impacts on the EUR/USD pair.
EUR/USD continues to trade in a bearish trajectory and is hovering at its 2-week low. The RSI is on the brink of breaking into the oversold zone, while the MACD continues to edge lower at below the zero line, suggesting that the bearish momentum remains strong.
Resistance level: 1.0853, 1.0900
Support level: 1.0816, 1.0770
NASDAQ, H4
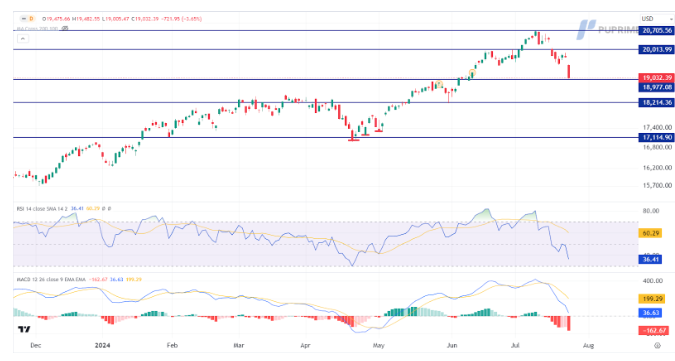
The US equity market experienced a sharp retreat as market volatility spiked to a three-month high, triggering panic selling. The bearish catalysts were primarily disappointing earnings reports from Tesla and Alphabet, which raised doubts about the sustainability of the 2024 rally driven by Big Tech and Artificial Intelligence. This led to a significant increase in the Cboe Volatility Index (VIX), known as Wall Street's fear gauge, which rose to 18.46, the highest level since late April. Nvidia, a key player in the market’s gains this year, fell 6% on Wednesday but remains up about 130% for the year. Despite the increase, the VIX index remains below the peaks reached during recent market selloffs, such as the October spike to 23.
Nasdaq is trading lower while currently testing the support level. MACD has illustrated increasing bearish momentum, while RSI is at 36, suggesting the index might extend its losses after breakout since the RSI stays below the midline.
Resistance level: 20015.00, 20705.00
Support level: 18975.00, 18215.00
USD/JPY, H4
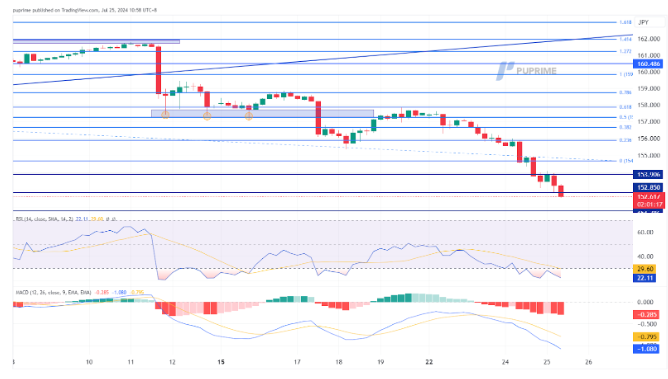
The Japanese yen has continued to strengthen, trading at a two-month low against the U.S. dollar. The dollar failed to regain its strength as the PMI readings came in mixed, hindering its upward momentum. Meanwhile, the yen continues to be bolstered by hawkish expectations for the Bank of Japan's upcoming interest rate decision due next week. Traders are closely monitoring these developments, which are likely to influence the USD/JPY pair's movement in the near term.
USD/JPY is currently trading with strong downside momentum, suggesting a bearish bias for the pair. The RSI remains in the oversold zone, while the MACD edged lower and diverged below the zero line, suggesting that the bearish momentum remains strong.
Resistance level: 152.85, 153.90
Support level: 151.78, 150.73
AUD/USD, H4
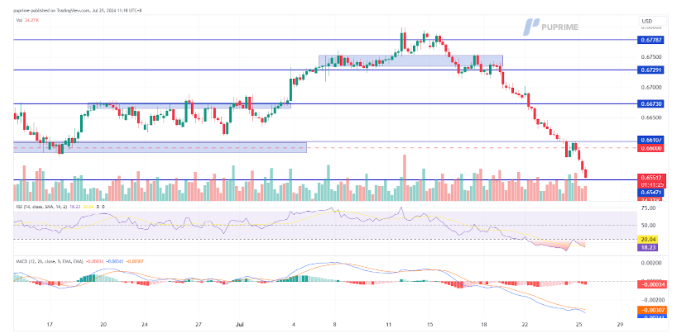
The Australian dollar continues to trade in a bearish trend against the U.S. dollar, hindered by dovish expectations for the Reserve Bank of Australia (RBA). The recent Australian unemployment rate and PMI readings suggest that the RBA may pivot from its current monetary tightening policy. This sentiment has led the AUD/USD pair to plunge by nearly 2% this week. Traders are keeping a close eye on further economic data and RBA statements to gauge the future direction of the pair.
The USD/USD pair continues to slide after breaking below the crucial liquidity zone, suggesting the pair is trading with strong bearish momentum. The RSI remains in the oversold zone while the MACD edge is lower below the zero line, which is in line with the bearish bias view.
Resistance level: 0.6610. 0.6670
Support level: 0.6500, 0.6420
CL OIL, H4
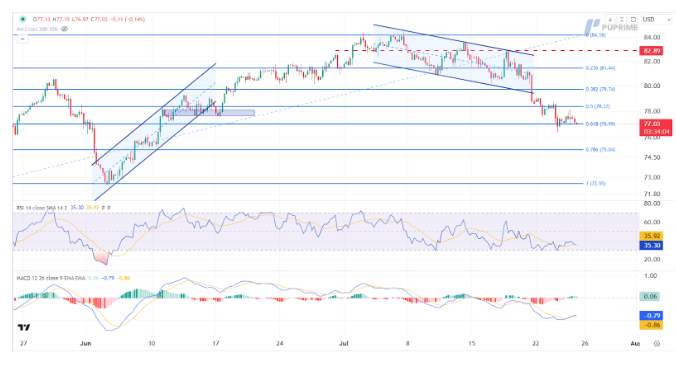
Crude oil prices rebounded slightly, supported by a bullish inventory report from the Energy Information Administration (EIA), which showed US crude oil inventories declining sharply by 3.741 million barrels, exceeding market expectations of a 2.600-million-barrel decline. Additionally, wildfires in Canada have forced some producers to curtail production, further reducing supply. However, the long-term trend for oil remains bearish due to concerns over economic performance in China, a major oil importer, and potential ceasefire talks in the Middle East weighing on prices.
Oil prices are trading lower while currently testing the support level. However, MACD has illustrated diminishing bearish momentum, while RSI is at 35, suggesting the commodity might enter oversold territory.
Resistance level: 78.35, 79.70
Support level: 77.00, 75.05


