-782024624.png)
-782024624.png)


Crude oil triangle

Oil reversed sharply from bullish to bearish on Tuesday, losing around 6.5% and below $75/bbl WTI. The reversal fits neatly into a tapered triangle pattern, with a setback from the upper boundary earlier in the week to the lower boundary. A knock to the upside from current levels would allow oil to return to $80 quickly. However, a break below the previous local lows at $74 would signal an exit from the consolidation pattern.
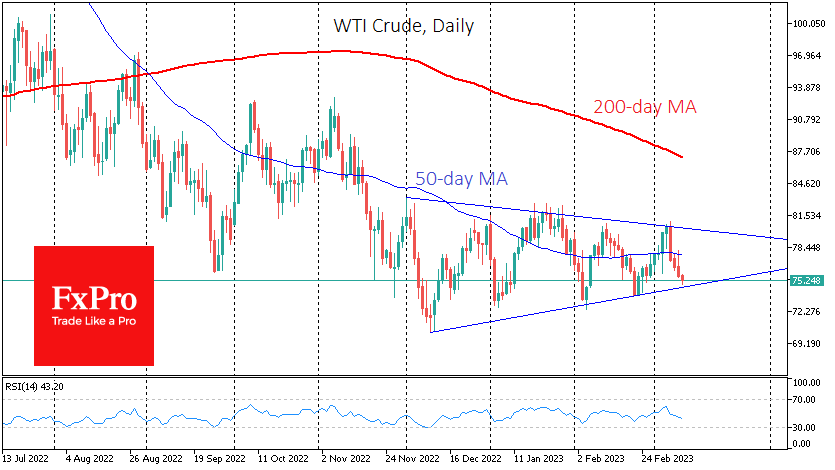
Since last December, oil has formed a triangle with its centre of gravity at $77 (the local lows of September and November) and a steadily shrinking trading range. Oil is successfully balancing news of production cuts and a strong labour market (positive) with monetary tightening and signs of falling demand.
A look at the charts suggests that oil is now choosing its path forward. A reversal to the upside from current levels could be the prologue to a relatively quick return to the $80s.
A close below $74.5 would signal a break in the consolidation pattern of recent months. Confirmation of the bearish signal would come with a drop below $74.0, close to where oil bounced in February. In that case, oil would face a smooth road to $62-63 by the end of the year’s first half.
By the FxPro analyst team


EBC Markets Briefing | Bullion eyes record high despite dollar comeback

US dollar could benefit from an unexciting ECB meeting

AUD/USD Rises Following Strong Australian Employment Data

Sector Winners and Losers: Which Industries Could Benefit or Suffer from the 2024 US Presidential Election Results?

The Crypto Market Stabilises at the Top

The “Harris Trade”: How Market Trends and Strategies Could Be Impacted If Harris Wins the US Presidency

Trump Trade 2024: Understanding Market Trends and Strategies Under Trump’s Economic Policies


