


COPPER Analysis: Be wary of extreme sentiment adjustments

Fundamental Analysis of COPPERCOPPER Key Takeaways
- Copper supply tightening: Since the beginning of the year, global copper mines have reduced production by about 250,000 tons, while Chile’s copper production in January fell 25% month-on-month, far higher than the seasonal average decline of 13%. This is reflected in the continued decline in refining and processing fees, highlighting the tightening of the copper concentrate market.
- US copper tariffs: On February 25, Trump signed an executive order to launch a Section 232 investigation, instructing to investigate whether copper imports and foreign copper production pose risks to the US economy and national security. Subsequently, COMEX copper prices have significantly strengthened relative to other global benchmark prices, and are now close to the historical high set in the second quarter of 2024, while the increase in COMEX copper prices is significantly stronger than that of LME copper.
Technical Analysis of COPPER Daily and Hourly ChartsCOPPER Daily Chart Insights
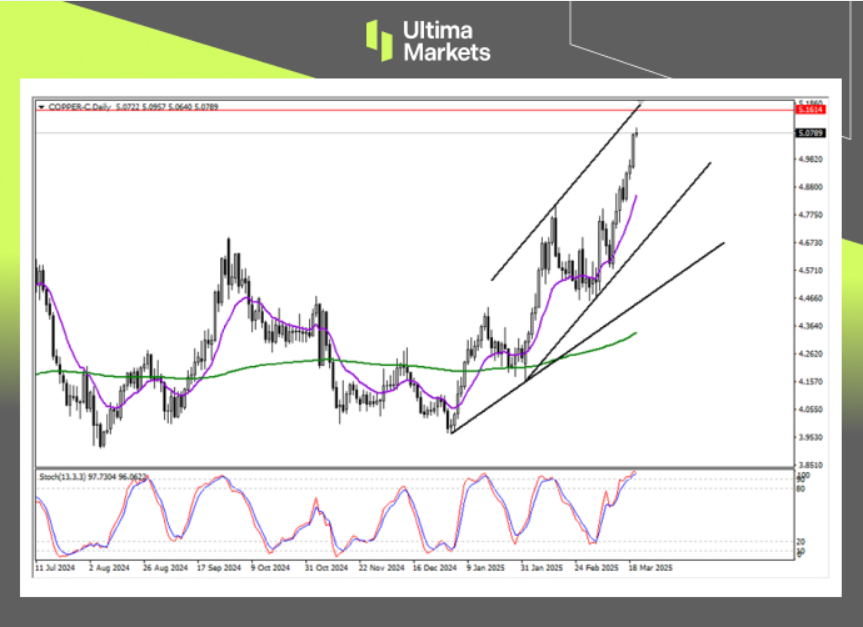
(COPPER Daily Price Chart, Source: Ultima Markets MT4)
- Stochastic oscillator: The indicator has shown extreme overbought conditions, and the theoretical listing price may adjust in the short term.
- Mean Reversion Expectation: The continuous rise in copper prices has deviated from the purple 13-day moving average, and the market price may return to the mean at any time.
COPPER H1 Chart Analysis
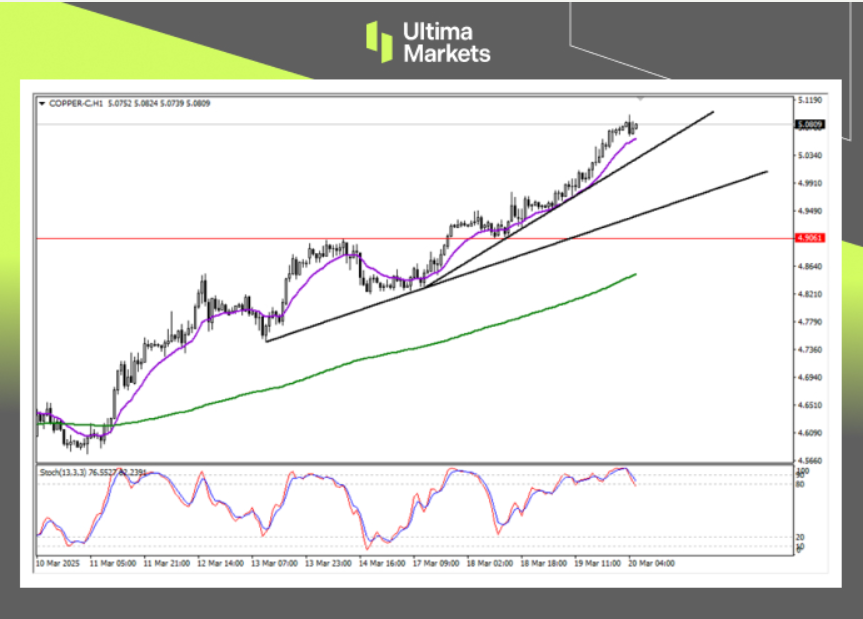
(COPPER H1 Price Chart, Source: Ultima Markets MT4)
- Stochastic oscillator: The indicator sent a short signal in the overbought area during the Asian session, but based on the strength of the daily level, investors are better off waiting for a top divergence with the market before paying attention to whether there is a pullback trend.
- Support below: The current copper price is very strong, and theoretically the upward trend line at this time is very critical. If the copper price falls below the purple 13-period moving average, pay attention to the upward trend line. Once the upward trend line is broken, it may usher in a longer period of adjustment.
Pivot Indicator Insights for COPPER
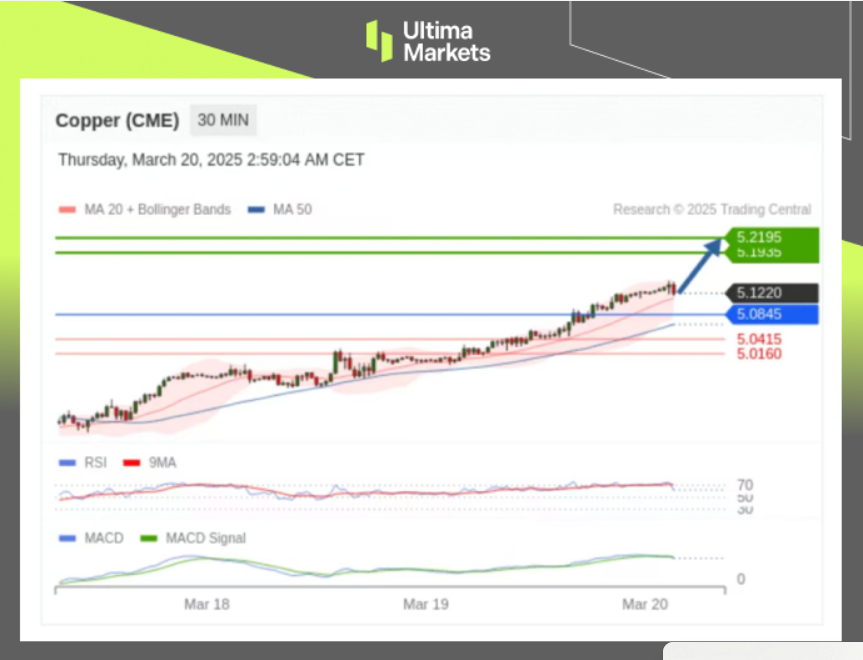
(COPPER M30 Price Chart, Source: Ultima Markets APP)
- According to Pivot Indicator in Ultima Markets APP, the central price of the day is established at 5.0845,
- Bullish Scenario: Bullish sentiment prevails above 5.0845, first target 5.1935, second target 5.2195;
- Bearish Outlook: In a bearish scenario below 5.0845, first target 5.0415, second target 5.0160.
How to Navigate the Forex Market with Ultima Markets To navigate the complex world of trading successfully, it’s imperative to stay informed and make data-driven decisions. Ultima Markets remains dedicated to providing you with valuable insights to empower your financial journey.
For personalized guidance tailored to your specific financial situation, please do not hesitate to contact Ultima Markets.
Join Ultima Markets today and access a comprehensive trading ecosystem equipped with the tools and knowledge needed to thrive in the financial markets.
Stay tuned for more updates and analyses from our team of experts at Ultima Markets.
Learn more: https://bit.ly/4gWTyEA
—–
Legal Documents
Ultima Markets, a trading name of Ultima Markets Ltd, is authorized and regulated by the Financial Services Commission “FSC” of Mauritius as an Investment Dealer (Full-Service Dealer, excluding Underwriting) (license No. GB 23201593). The registered office address: 2nd Floor, The Catalyst, 40 Silicon Avenue, Ebene Cybercity, 72201, Mauritius.
Copyright © 2025 Ultima Markets Ltd. All rights reserved.
Disclaimer
Comments, news, research, analysis, price, and all information contained in the article only serve as general information for readers and do not suggest any advice. Ultima Markets has taken reasonable measures to provide up-to-date information, but cannot guarantee accuracy, and may modify without notice. Ultima Markets will not be responsible for any loss incurred due to the application of the information provided.

Risk rally struggles for momentum as tariff uncertainty persists

A Global Vision in Action: EBC Asset Management Takes Sydney by Storm

Daily Global Market Update – 25th March, 2025

EBC Million Dollar Trading Challenge II | Gold Trading Takes Centre Stage as Dream Squad's New Talent Shines

ATFX Market Outlook 25th March 2025

USDJPY, GBPUSD, AUDUSD

Daily Global Market Update – 24th March, 2025


