AUDUSD Analysis: The Australian dollar is on the line
Fundamental Analysis of AUDUSDAUDUSD Key Takeaways
- Today’s data: The United States will release the number of initial jobless claims for the week ending January 18; at the same time, Canada will also release the monthly rate of retail sales in November.
- US-Australia interest rate differential: The outlook for interest rates in the United States has changed due to inflation and the risks of Trump’s new presidency. For Australia, this increases the risk of inflation. The market expects that unless the inflation rate in the fourth quarter falls to at least 3.25% from 3.5% in the third quarter, the pace of interest rate cuts by the Reserve Bank of Australia will slow down.
Technical Analysis of AUDUSD Daily and Hourly ChartsAUDUSD Daily Chart Insights

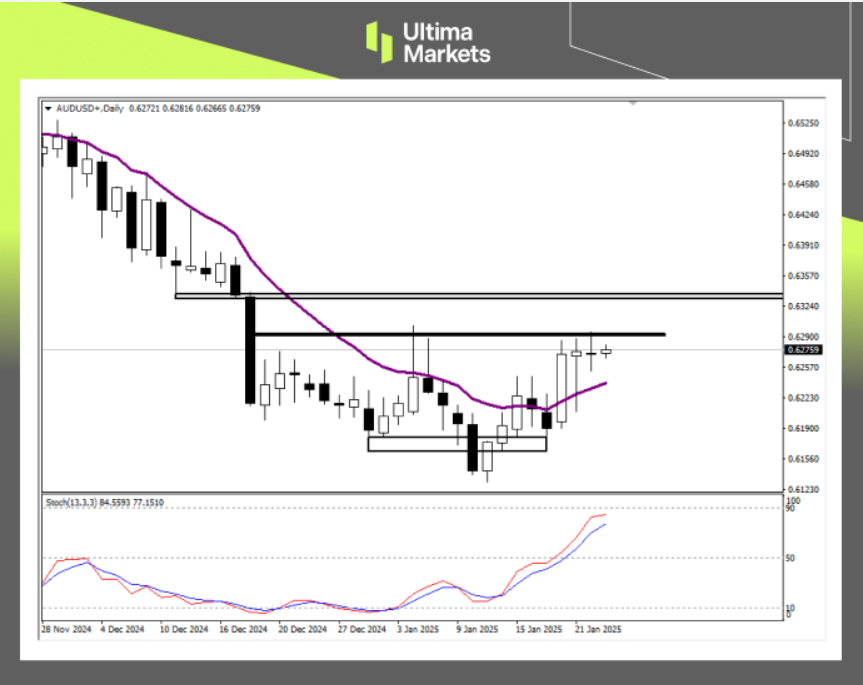
(AUDUSD Daily Price Chart, Source: Ultima Markets MT4)
- Stochastic oscillator: The upward momentum of the fast and slow lines slowed down yesterday, and the fast line showed signs of turning, suggesting that the current bullish force slowed down, but if no short signal is formed today, the bullish trend is expected to continue.
- Head and shoulders bottom: After the AUD/USD ended its decline on January 13, it formed a bottom structure suspected of head and shoulders bottom. The exchange rate is currently blocked by the black horizontal line. After the price effectively breaks through this resistance level, the next target is to look at the upper rectangular resistance band.
AUDUSD 1-hour Chart Analysis

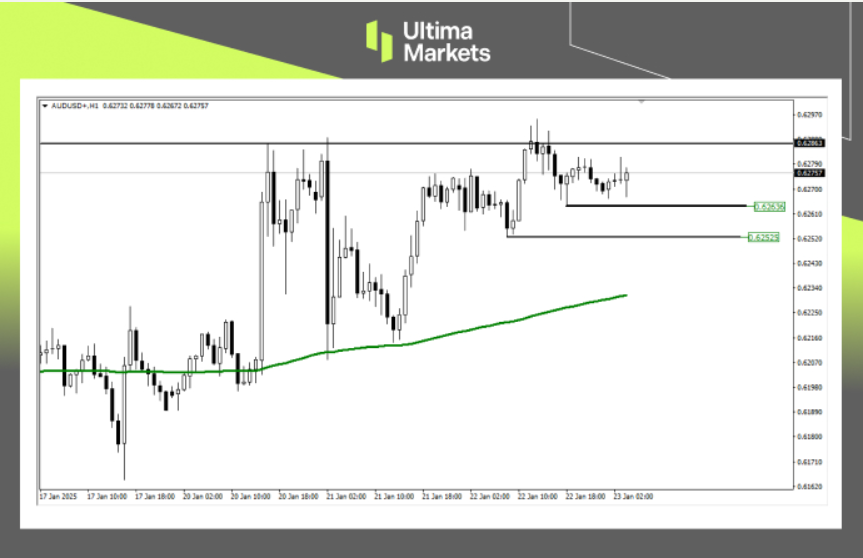
(AUDUSD H1 Price Chart, Source: Ultima Markets MT4)
- Liquidity: After the AUD/USD hit the previous high of 0.62863 yesterday, a false breakout pattern appeared. From the perspective of ICT strategy, it is a typical plunder of the upper bullish liquidity. If the exchange rate continues to fall to the 0.62636 level, the exchange rate will still not be able to break through the previous high price during the Asian session.
- Support price: Based on the short-term decline logic during the Asian session, the two support levels below the current exchange rate are 0.62636 and 0.62525.
H2 : Pivot Indicator Insights for AUDUSD

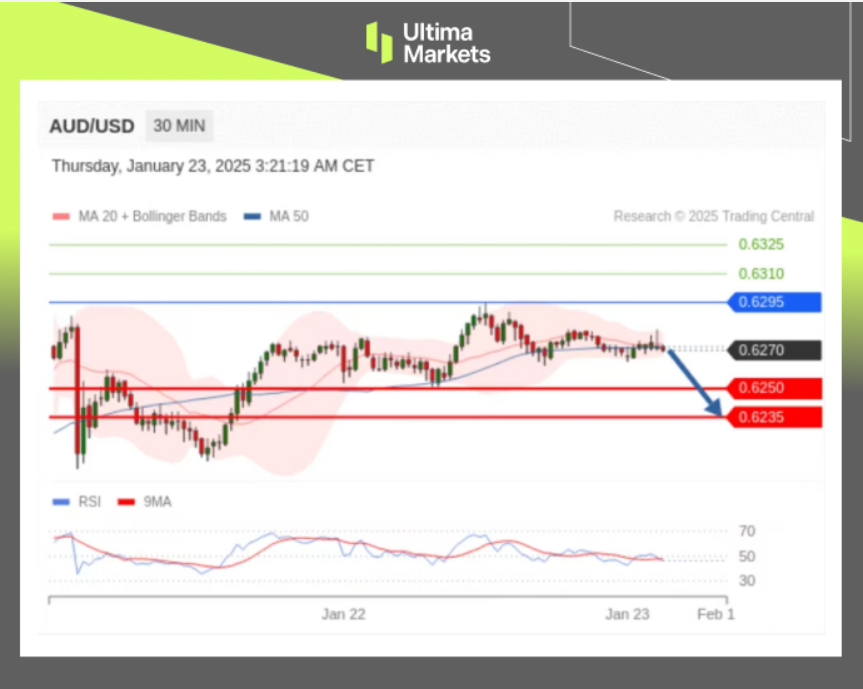
(AUDUSD M30 Price Chart, Source: Ultima Markets APP)
- According to Pivot Indicator in Ultima Markets APP, the central price of the day is established at 0.6295,
- Bullish Scenario: Bullish sentiment prevails above 0.6295, first target 0.6310, second target 0.6325;
- Bearish Outlook: In a bearish scenario below 0.6295, first target 0.6250, second target 0.6235.
How to Navigate the Forex Market with Ultima Markets To navigate the complex world of trading successfully, it’s imperative to stay informed and make data-driven decisions. Ultima Markets remains dedicated to providing you with valuable insights to empower your financial journey.
For personalized guidance tailored to your specific financial situation, please do not hesitate to contact Ultima Markets.
Join Ultima Markets today and access a comprehensive trading ecosystem equipped with the tools and knowledge needed to thrive in the financial markets.
Stay tuned for more updates and analyses from our team of experts at Ultima Markets.
—–
Legal Documents
Ultima Markets, a trading name of Ultima Markets Ltd, is authorized and regulated by the Financial Services Commission “FSC” of Mauritius as an Investment Dealer (Full-Service Dealer, excluding Underwriting) (license No. GB 23201593). The registered office address: 2nd Floor, The Catalyst, 40 Silicon Avenue, Ebene Cybercity, 72201, Mauritius.
Copyright © 2025 Ultima Markets Ltd. All rights reserved.
Disclaimer
Comments, news, research, analysis, price, and all information contained in the article only serve as general information for readers and do not suggest any advice. Ultima Markets has taken reasonable measures to provide up-to-date information, but cannot guarantee accuracy, and may modify without notice. Ultima Markets will not be responsible for any loss incurred due to the application of the information provided.


