


NZD/USD Analysis: Beware of intraday false breakouts

Fundamental Analysis of NZDUSD
NZDUSD Key Takeaways
Chief economist of the RBNZ: A weaker NZD will help the economic recovery and will support export revenues. The output gap will constrain inflationary pressures. Intentionally ignore the rise in inflation this year.
Fed members’ speeches: Bostic still expects two rate cuts this year, but there is great uncertainty; Goolsby: PCE data is unlikely to be as alarming as CPI data. If tariffs lead to higher inflation, the Fed will consider this; Kugler: PCE inflation is expected to be 2.4% in January and core PCE inflation is 2.6%; there is still a certain gap from the 2% target.
Technical Analysis of NZDUSD Daily and Hourly ChartsNZDUSD Daily Chart Insights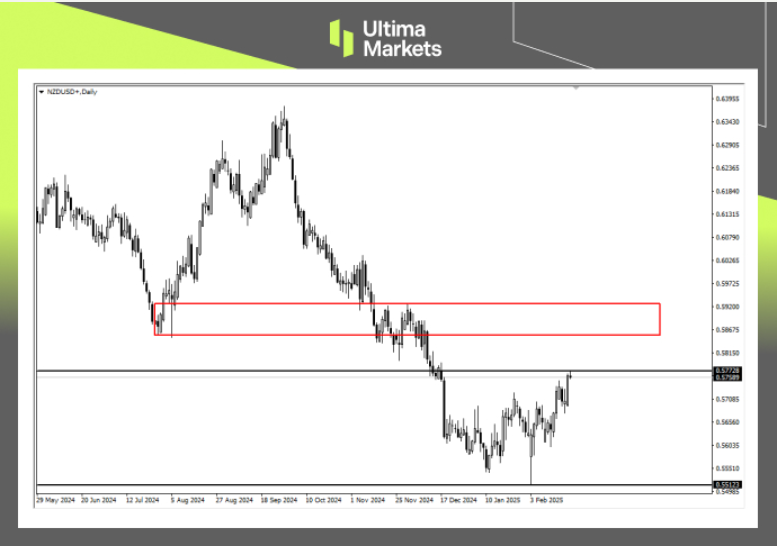
(NZDUSD Daily Price Chart, Source: Ultima Markets MT4)
Key resistance: The exchange rate rose rapidly yesterday to the key resistance level of 0.57728, which is the low point in 2023 and the long-term key resistance price, so there is a probability of a downward adjustment today.
Appreciation trend looks at the gap: Since the NZD/USD has fallen by more than 800 points since early October last year, even if the exchange rate breaks through the key resistance price in the short term, it is still regarded as a rebound. The long-term appreciation trend requires the exchange rate to break through the red rectangular gap.
NZDUSD H1 Chart Analysis
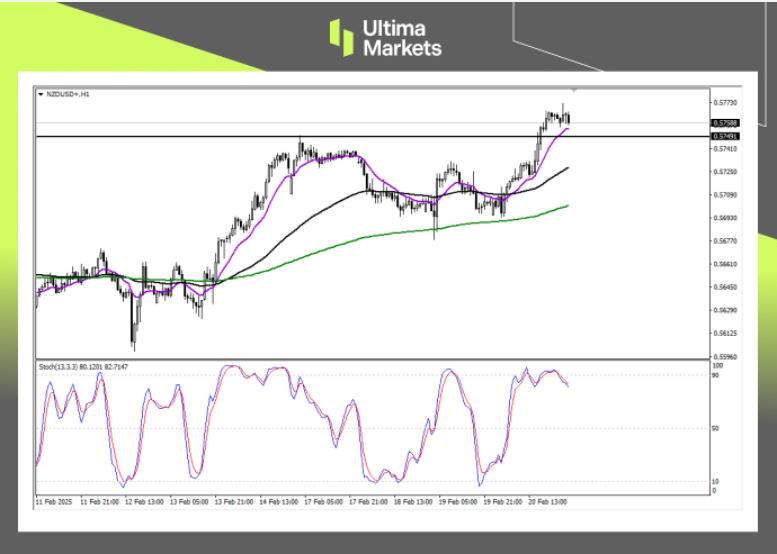 (NZDUSD H1 Price Chart, Source: Ultima Markets MT4)
Stochastic oscillator: The indicator sends a short signal in the overbought area, suggesting that short-term shorts have the upper hand again, and be alert that the exchange rate will consolidate during the Asian session.Support price: Based on the current exchange rate being close to the support price of 0.57491 below, the exchange rate may show a sideways consolidation or a false breakout in the short term, but shorting cannot be done at will before the exchange rate falls below the support price.
Pivot Indicator Insights for NZDUSD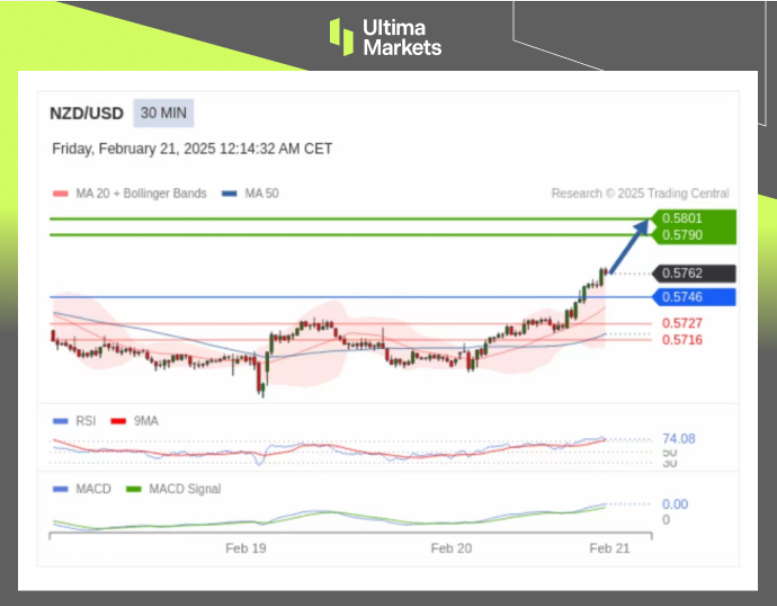
(NZDUSD M30 Price Chart, Source: Ultima Markets APP)
According to Pivot Indicator in Ultima Markets APP, the central price of the day is established at 0.5746,
Bullish Scenario: Bullish sentiment prevails above 0.5746, first target 0.5790, second target 0.5801;
Bearish Outlook: In a bearish scenario below 0.5746, first target 0.5727, second target 0.5716.
How to Navigate the Forex Market with Ultima Markets To navigate the complex world of trading successfully, it’s imperative to stay informed and make data-driven decisions. Ultima Markets remains dedicated to providing you with valuable insights to empower your financial journey.
For personalized guidance tailored to your specific financial situation, please do not hesitate to contact Ultima Markets.
Join Ultima Markets today and access a comprehensive trading ecosystem equipped with the tools and knowledge needed to thrive in the financial markets.
Stay tuned for more updates and analyses from our team of experts at Ultima Markets.
—–
Legal Documents
Ultima Markets, a trading name of Ultima Markets Ltd, is authorized and regulated by the Financial Services Commission “FSC” of Mauritius as an Investment Dealer (Full-Service Dealer, excluding Underwriting) (license No. GB 23201593). The registered office address: 2nd Floor, The Catalyst, 40 Silicon Avenue, Ebene Cybercity, 72201, Mauritius.
Copyright © 2025 Ultima Markets Ltd. All rights reserved.
Disclaimer
Comments, news, research, analysis, price, and all information contained in the article only serve as general information for readers and do not suggest any advice. Ultima Markets has taken reasonable measures to provide up-to-date information, but cannot guarantee accuracy, and may modify without notice. Ultima Markets will not be responsible for any loss incurred due to the application of the information provided.

New Zealand Dollar Near Two-Year Low: USD and China are ‘to Blame’

NZD/USD at a New Low: The Problem is the US Dollar and Local GDP

Dollar Jumps on Fed’s Hawkish Remark

Global Currency Trends: What They Reveal About the World Economy

Dollars, Data, and Decisions Key Insights from November's Market Trends

NZD/USD Hits Yearly Low Amid US Dollar Strength

NZDUSD, USDJPY, EURUSD


